The Tech Stack Stress Test: How to Audit Your Systems Before They Break Your Business
Blog
8/06/25
Benchmark confidence. Expose blind spots. Build a stack you can trust.
Overview
In high-velocity businesses like restaurants, retail, and CPG, technology isn’t just an enabler, it’s a point of failure. And yet, many CFOs and CIOs rate their confidence in the tech stack somewhere between 55% and 86%. Translation: it works... until it doesn’t.
This isn’t about downtime alone. It’s about underperforming systems silently costing you in labor, revenue, and guest experience, without ever triggering an alert.
At Stable Kernel, we’ve developed a practical framework to stress test your stack before it breaks your business, giving finance and technology leaders a shared lens to benchmark performance, uncover “unknown unknowns,” and prioritize modernization where it counts.
What Is a Tech Stack Stress Test?
Think of it like a pre-mortem for your systems — a structured audit that surfaces:
- Fragile integrations and outdated components
- Workflow slowdowns and manual workarounds
- Blind spots in observability, traceability, or real-time sync
- Bottlenecks impacting key financial or operational KPIs
- This isn’t a generic health check. It’s a KPI-tied assessment that maps confidence to business impact.
Step 1: Map System Confidence to Business Outcomes
Action:
Have IT and finance leaders independently rate their confidence in each major system on a 1–100 scale.
- POS / Order Management
- Inventory & Supply Chain
- CRM / Loyalty / Customer Data Platform
- Labor Scheduling / Workforce Management
- Kitchen Ops / Prep Coordination
- Digital Ordering / Kiosk / Mobile
- Reporting & Analytics Infrastructure
Then, align those scores to real-world business KPIs:
Use Case #1
- System: POS
- Confidence: 72%
- Related KPIs: Order accuracy, basket size, payment uptime
Use Case #2
- System: Inventory
- Confidence: 63%
- Related KPIs: Spoilage %, stockouts, prep errors
Use Case #3
- System: CRM
- Confidence: 55%
- Related KPIs: Personalization rate, loyalty engagement
Use Case #4
- System: Scheduling
- Confidence: 68%
- Related KPIs: Labor cost variance, OT incidence
Use Case #5
- System: Kitchen Ops
- Confidence: 60%
- Related KPIs: Ticket time, throughput rate
Tip: Anywhere confidence is under 85% and tied to a lagging KPI — flag it for deeper investigation.
Step 2: Identify “Unknown Unknowns”
Action:
Interview store-level managers and frontline staff with a single question:
“What do you do when the system doesn't work exactly the way it should?”
Common red flags:
- "We just print and rewrite tickets."
- "I manually re-enter guest data if it doesn’t sync."
- "We stop using the app when it gets slow."
- "We track orders on a whiteboard when KDS goes down."
These manual fixes indicate systemic brittleness, and they rarely show up in traditional analytics.
Tip: Pair this with support ticket data, NPS comments, or IT incident logs to surface hidden failure patterns.
Step 3: Benchmark Against Business Cost Centers
Action:
Correlate system fragility with hard costs:
- Labor cost overruns due to manual workarounds
- Refunds or remakes due to order sync issues
- Lost upsells due to malfunctioning promo logic
- Downtime-related revenue impact (even partial)
Create a scorecard:
Area: POS
- Issue: Order delays from failed integration
- Est. Cost Impact (Monthly): $18,000
Area: CRM
- Issue: Uncaptured loyalty offers
- Est. Cost Impact (Monthly): $9,500
Area: Inventory
- Issue: Overstock from forecasting errors
- Est. Cost Impact (Monthly): $12,200
Tip: CFOs can translate these costs into ROI potential for system upgrades or microservice decoupling
Step 4: Prioritize Modernization by Business Impact
Action:
Build a modernization backlog using three dimensions:
- Risk: How likely is failure?
- Impact: What’s the cost of failure?
- Velocity: How quickly can this be modernized?
Create a priority matrix:
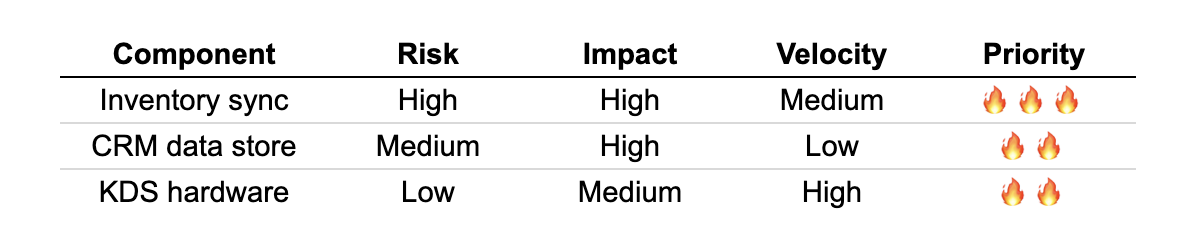
Tip: Focus first on high-risk, high-impact, medium-velocity components for near-term ROI.
Step 5: Design for Continuous Confidence
Action:
Move from one-time audit to ongoing observability. This means:
- Implementing real-time system health dashboards
- Building in self-healing architecture and fallback workflows
- Using CI/CD pipelines for non-disruptive updates
- Setting confidence SLAs (e.g., “99% system sync uptime”) between teams
Tip: Stable Kernel helps clients embed observability tools and microservices to support real-time alerting, graceful failure, and continuous improvement.
Final Thought: Confidence Isn’t a Feeling — It’s a Metric
If your current stack only works “most of the time,” it’s not just a tech issue — it’s a growth limiter, a brand risk, and a drag on margin.
A proper stress test helps you connect systems to outcomes, confidence to cost, and architecture to action. And with the right framework, you don’t just find what’s broken, you build toward what’s next.
Ready to pressure-test your stack? Stable Kernel can help.